EnvGeo-Seawater User Guide
Version 1.3.4 · Interactive seawater isotope and hydrographic data exploration
EnvGeo-Seawater helps users explore curated seawater isotope and hydrographic data, including regional and global reference datasets, alongside their own uploaded observations. This guide documents the supported stable workflows.
The application is intended for interactive exploration and quality checking. For analysis, figures, publications, or presentations, cite both EnvGeo-Seawater and the original data providers used.
A first workflow
- Open a visualization page from the application sidebar.
- Choose a reference dataset and adjust the shared data filters.
- Select Apply settings to update tables and figures.
- Explore maps, T–S space, depth profiles, and other views.
- Optionally upload a CSV or XLSX file in pages that provide the user-data workflow; uploaded data remain in the current session.
Choose a guide
Start here
Interactive exploration
Analysis and figure generation
- Isotope & Hydrographic Mapping
- Temperature–Salinity Diagram
- Salinity–δ18O Relationship
- Custom Parameter Plot
- Depth Profile
- Vertical Section Visualizer
Data, citation, and support
- Data-source and citation information
- Current update history
- Offline and degraded-network operation
- Testing and supported environment
- Stable-release scope
Examples
The following figures illustrate the range of supported exploratory views.
Global isotope distribution
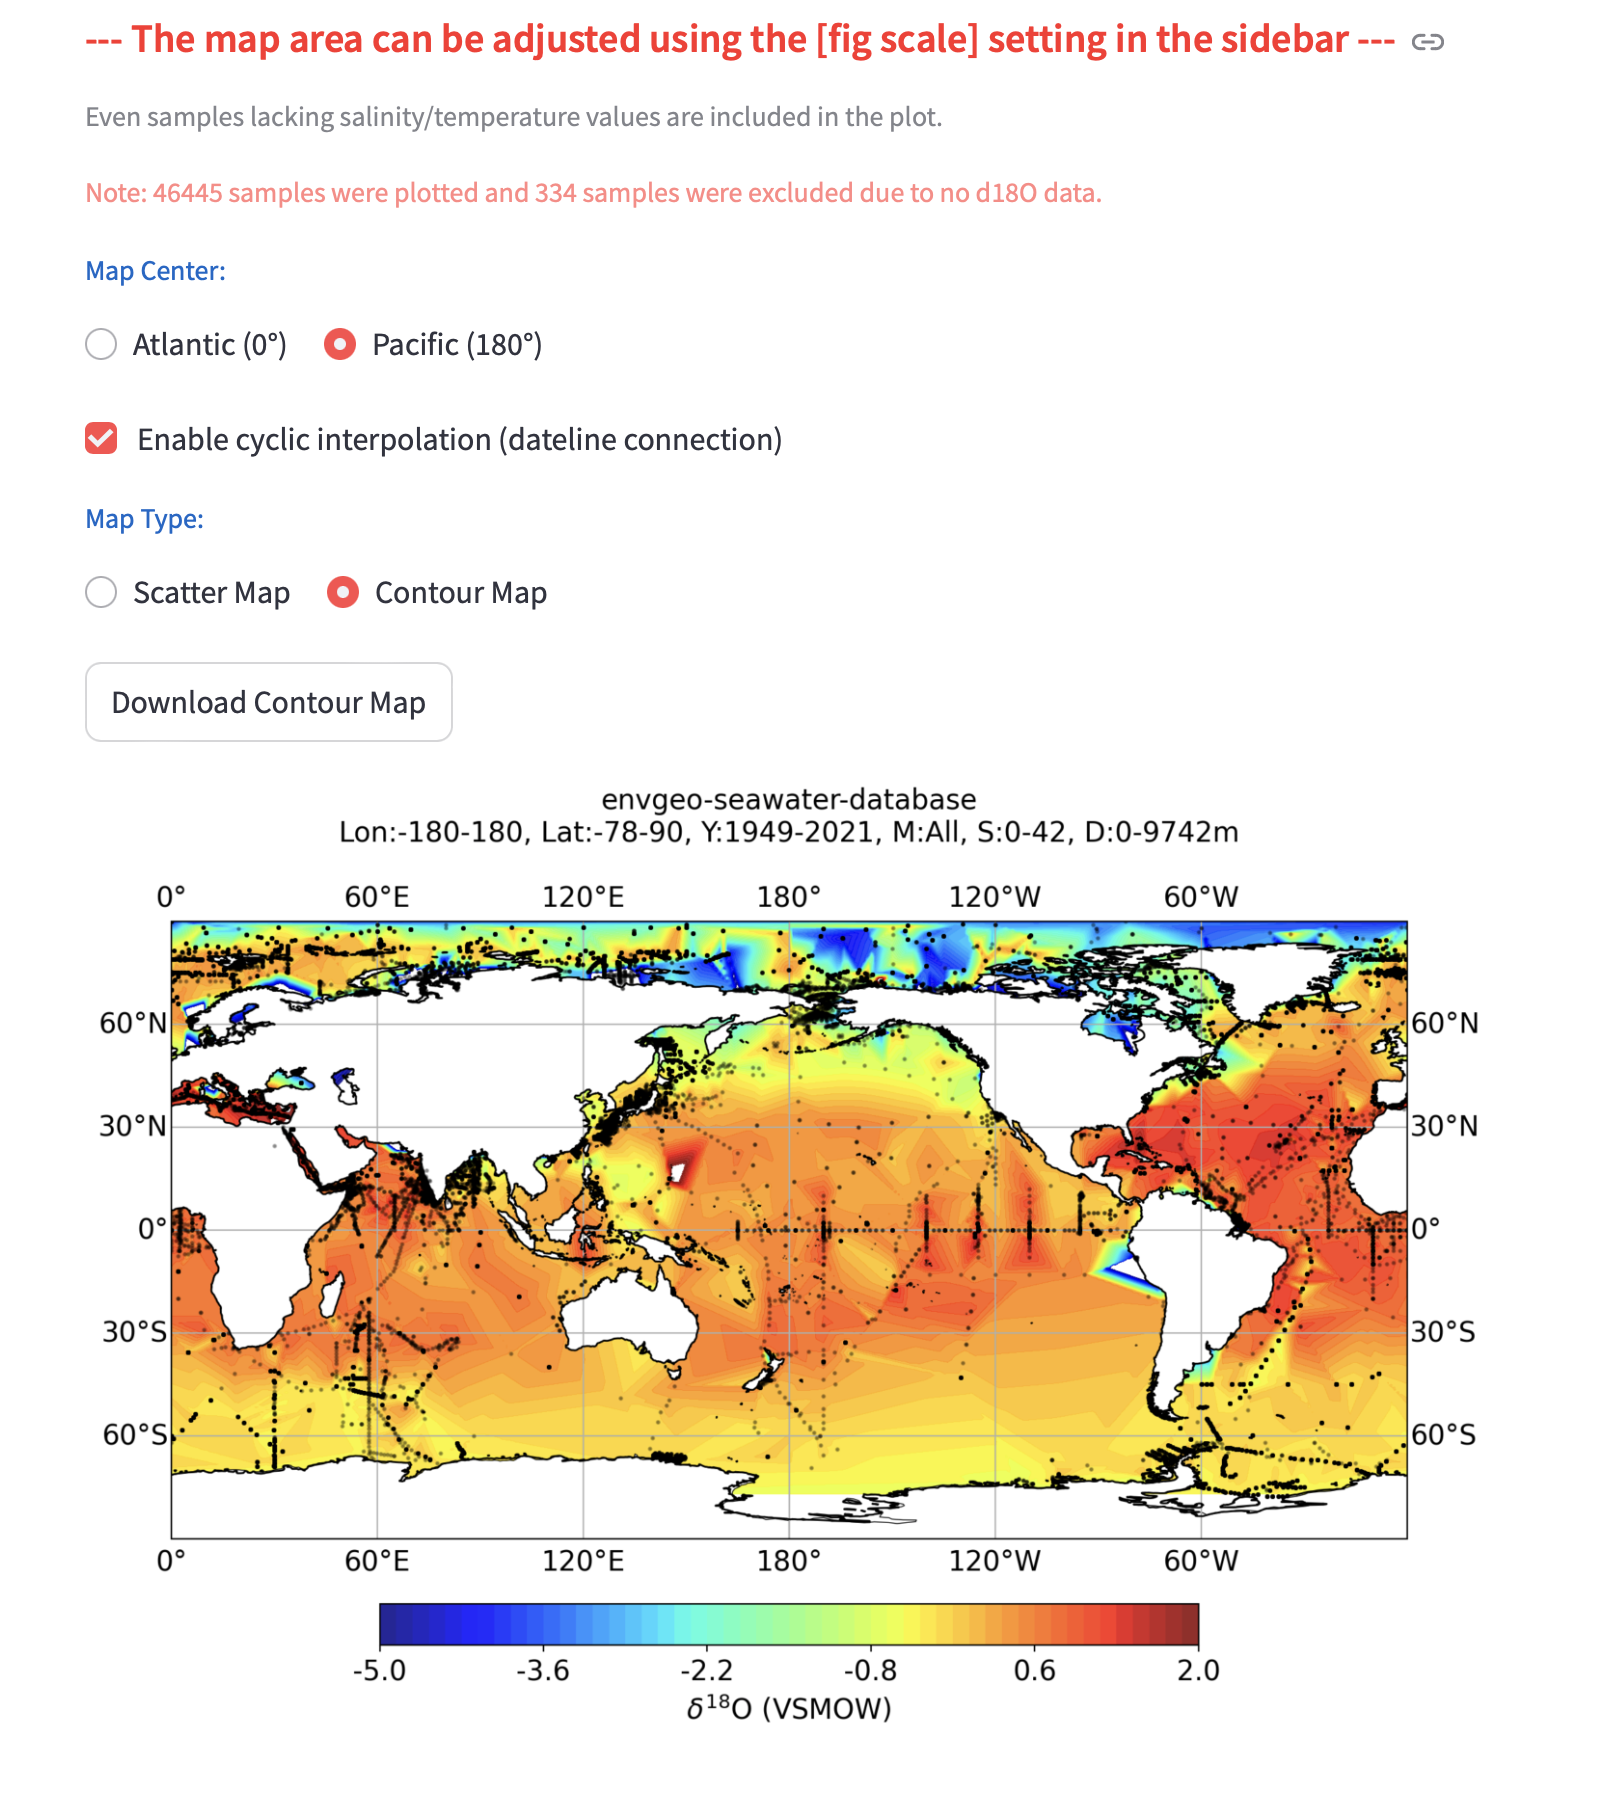
This contour map shows global seawater δ18O using the integrated reference datasets (approximately 50,000 records). Contour interpolation is intended to help explore broad oceanographic patterns and basin-scale variability.
Temperature–salinity diagram
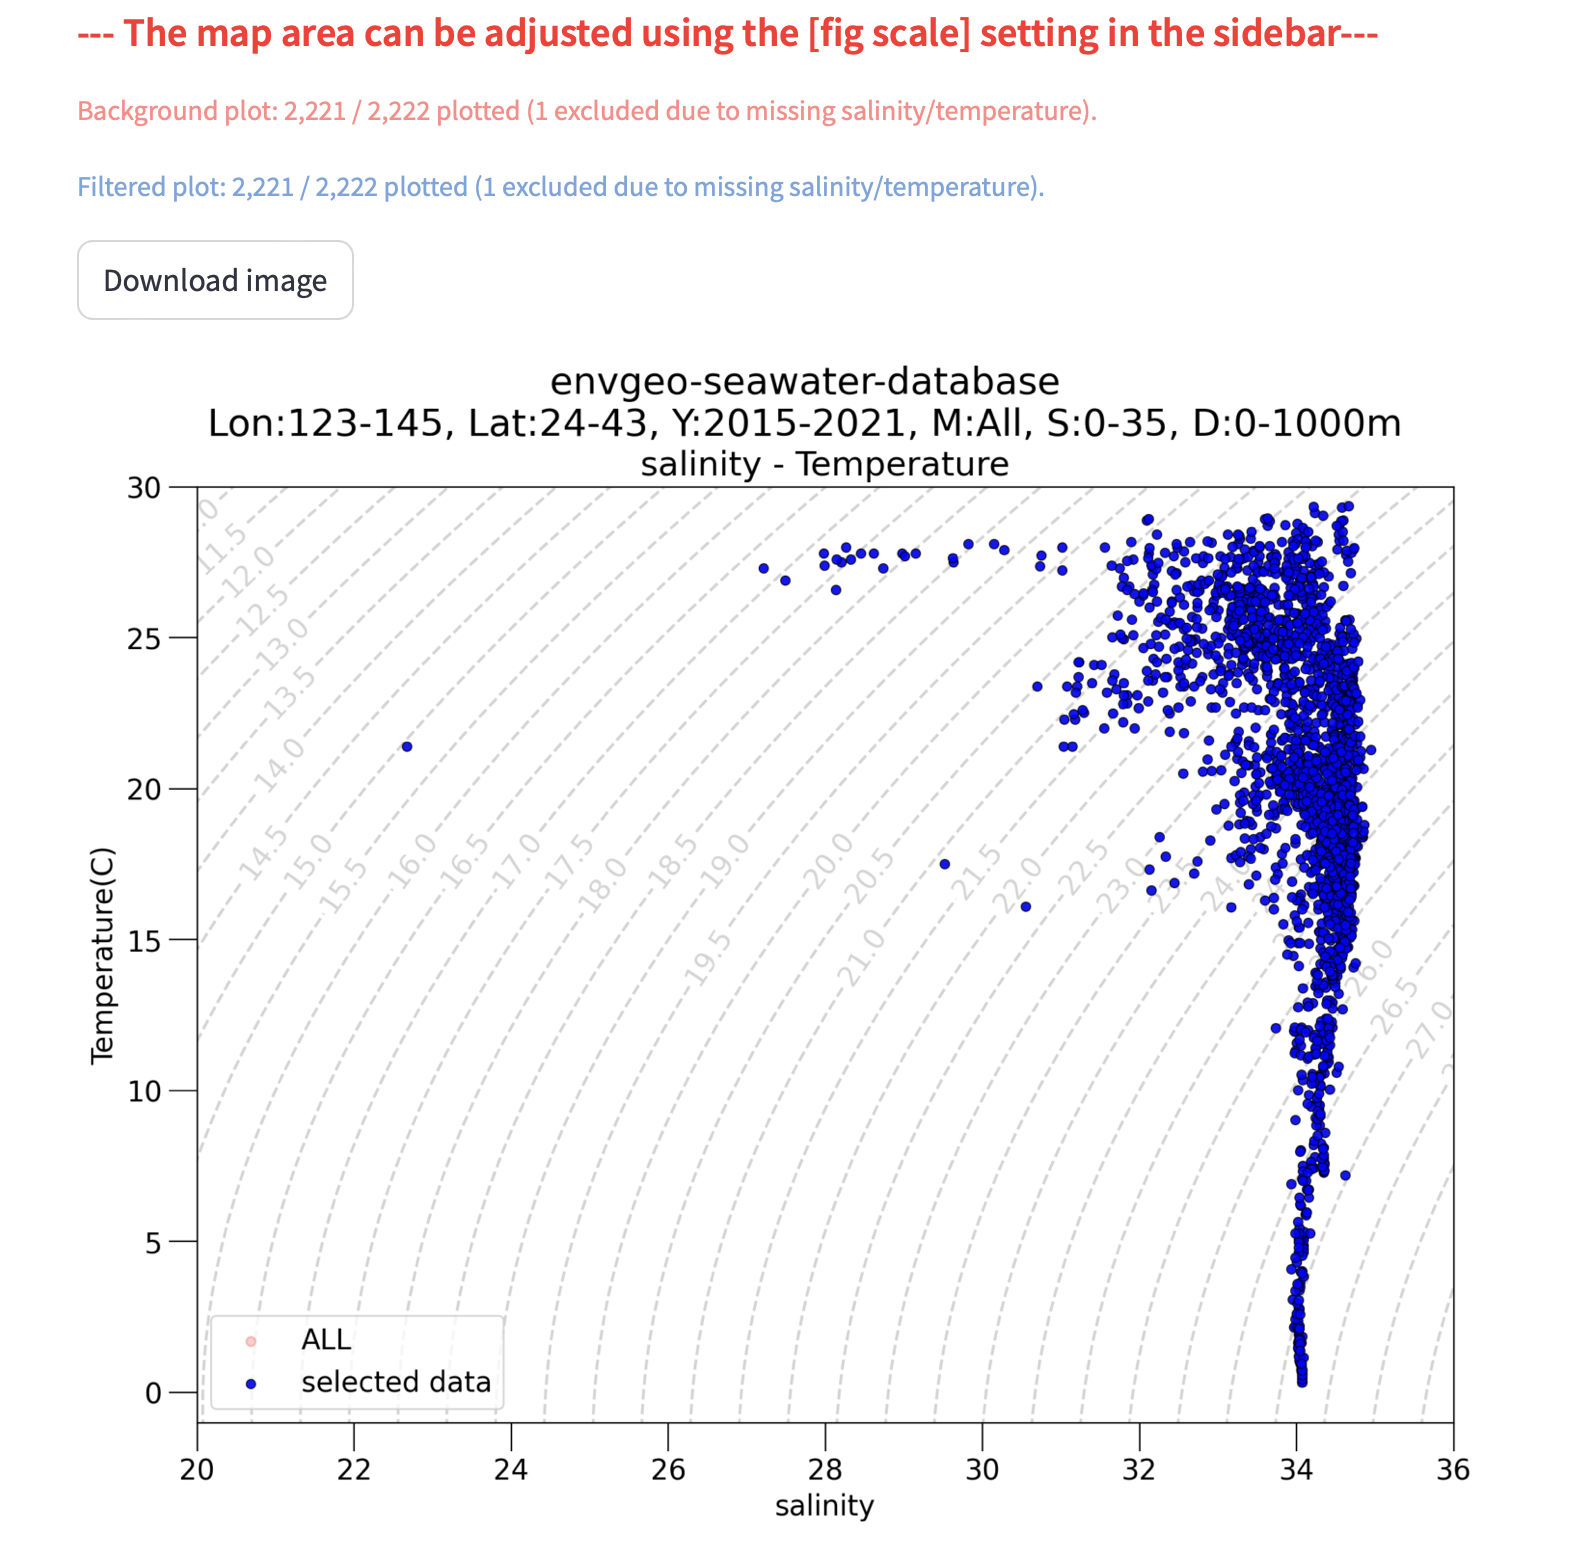
The T–S view overlays approximate σ0 reference contours. Practical Salinity is used as an approximation of Absolute Salinity, and in-situ temperature as an approximation of Conservative Temperature; the contours are reference guides, not a substitute for a full TEOS-10 calculation.
4D visualization
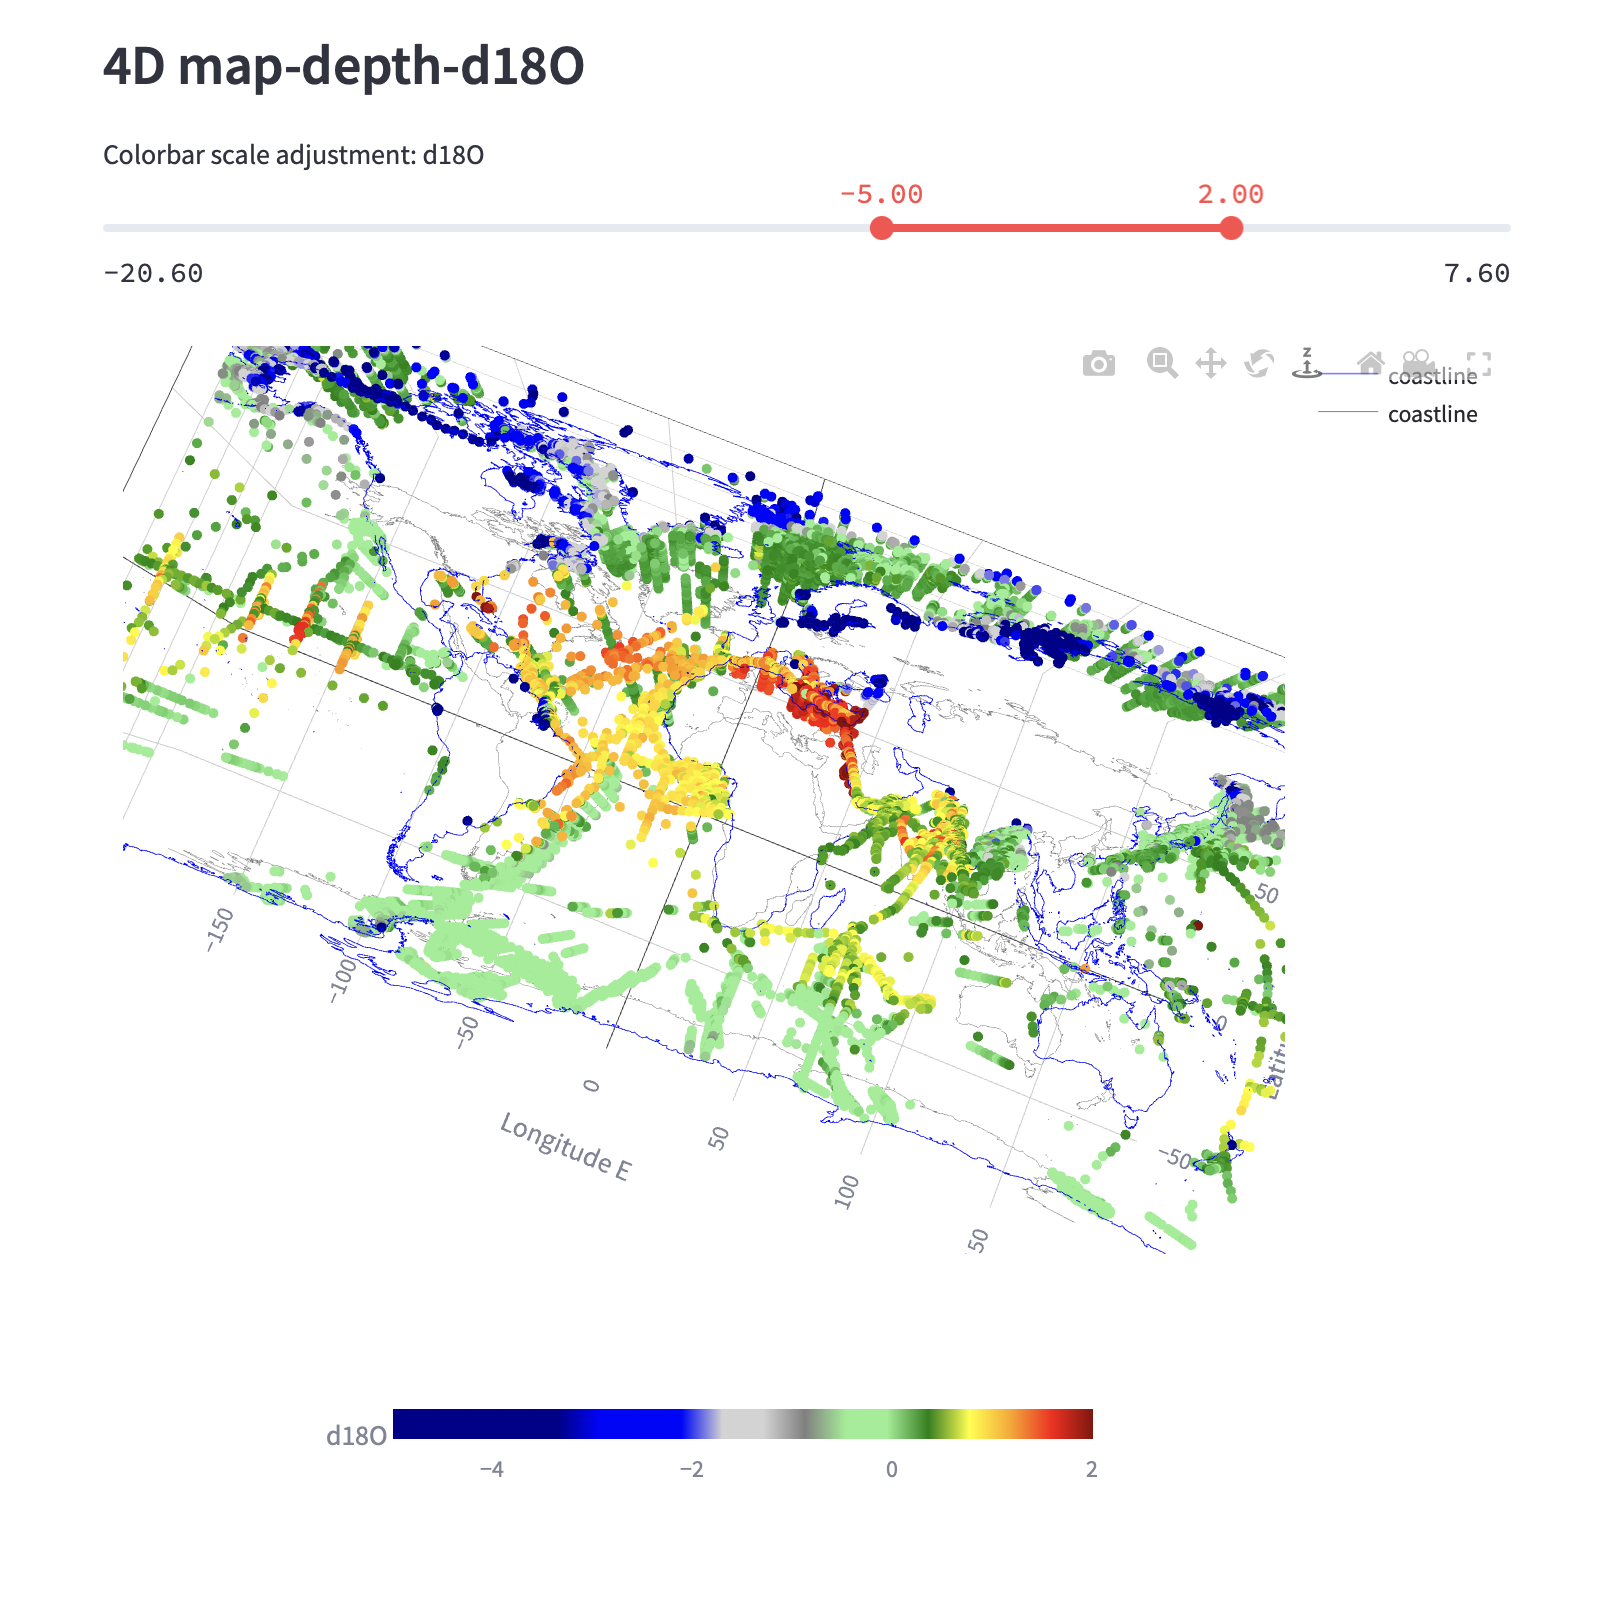
Longitude, latitude, depth, and isotope information can be explored together to inspect spatial gradients and vertical structure.
Linked interactive selection
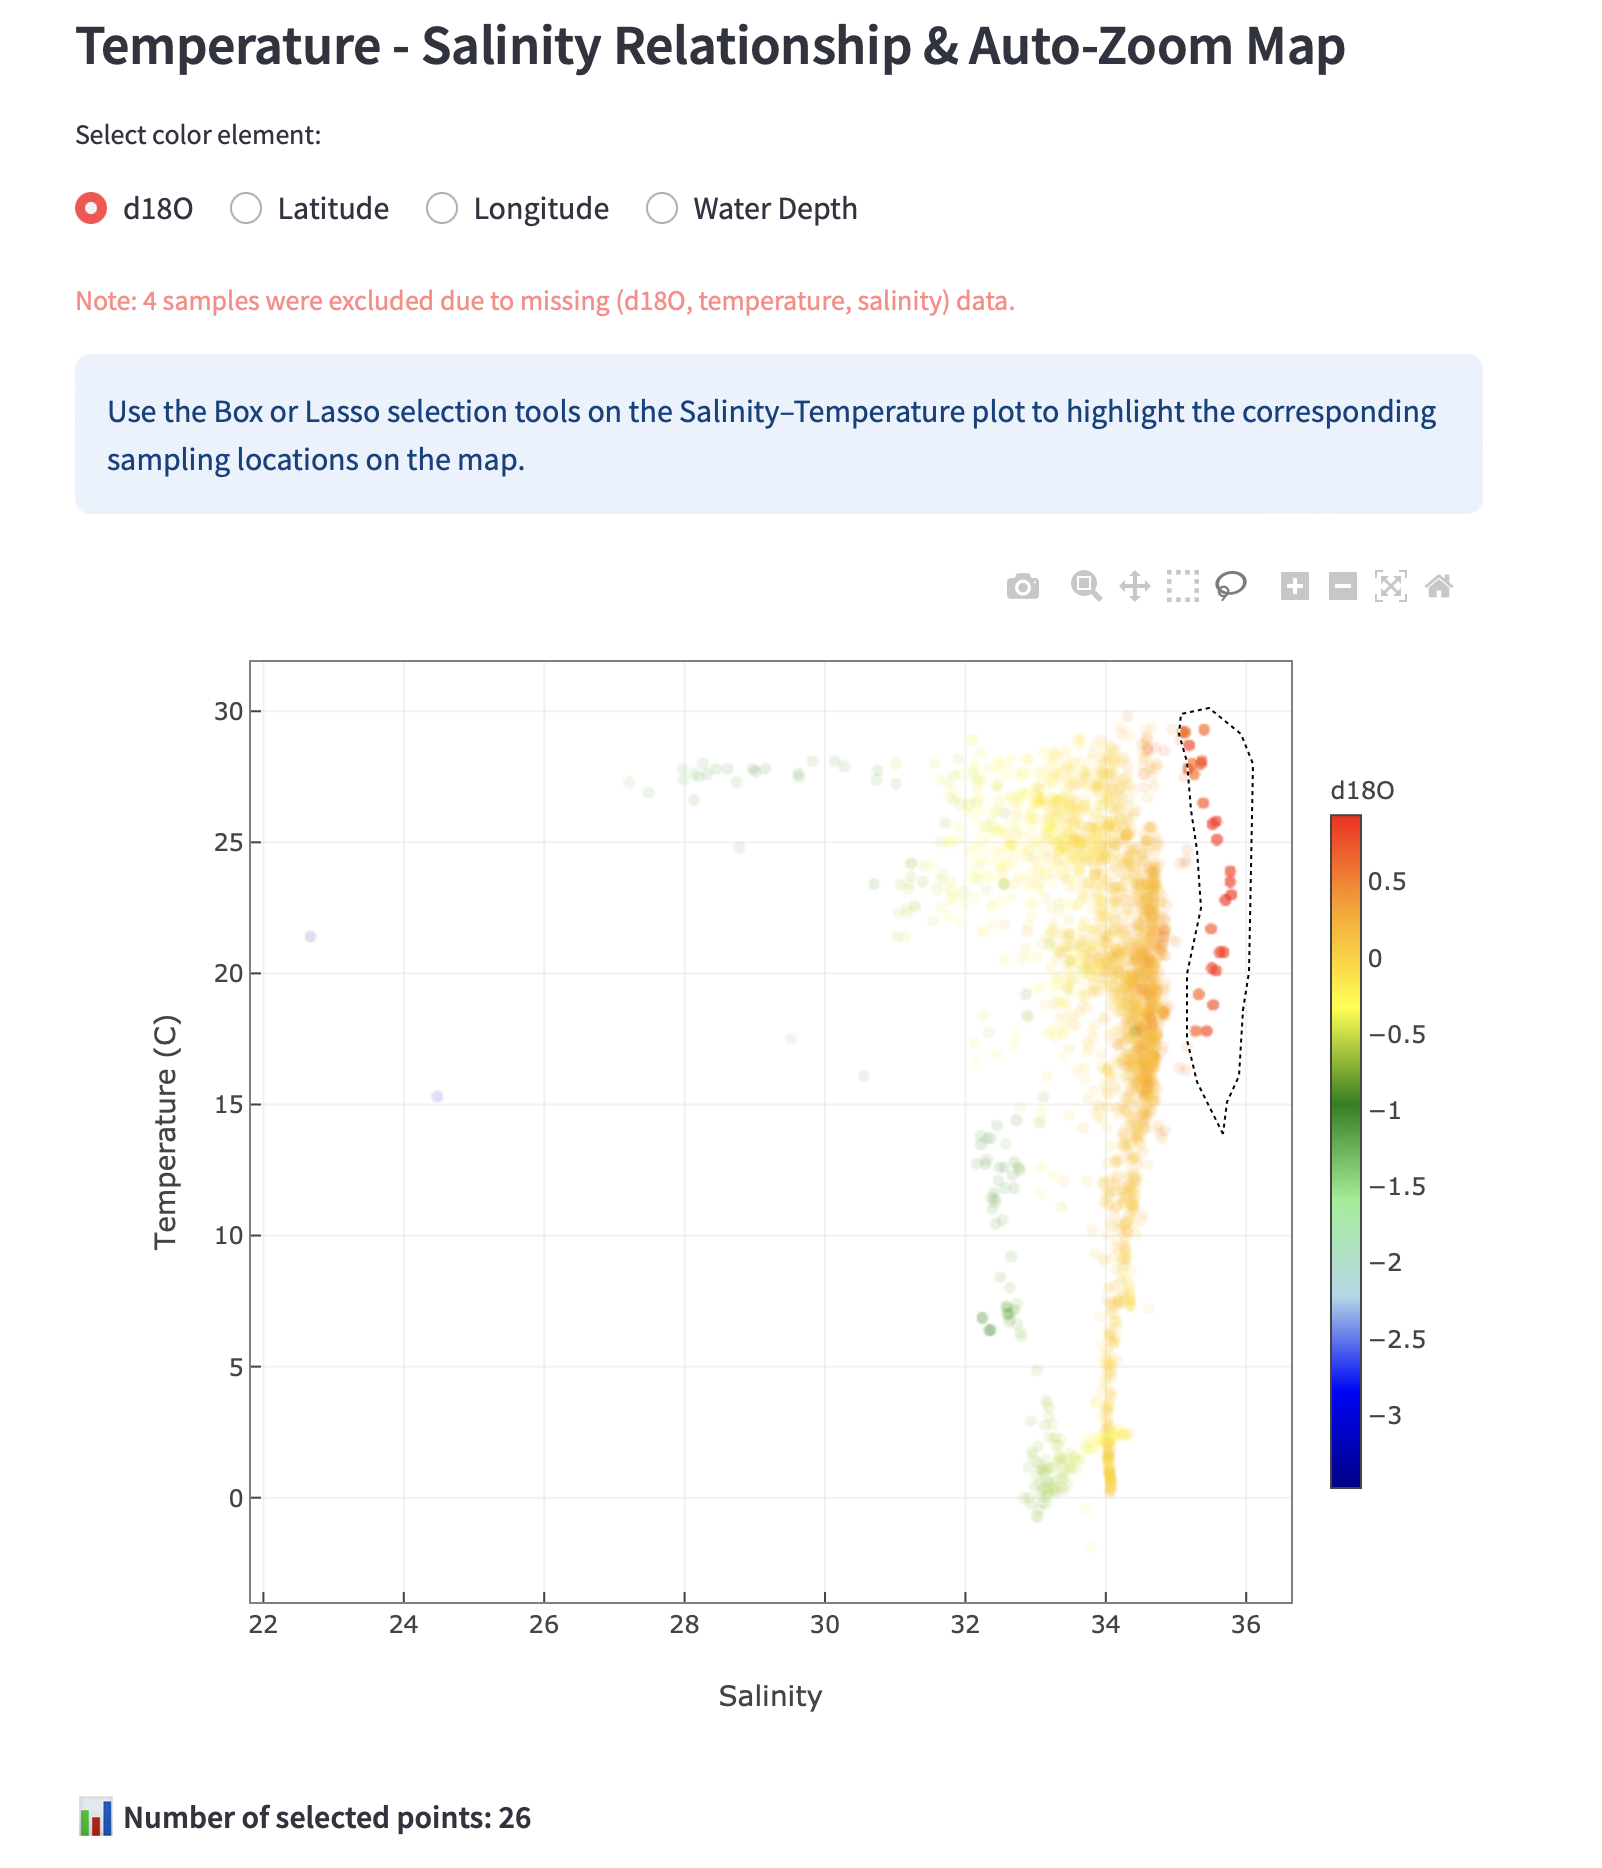
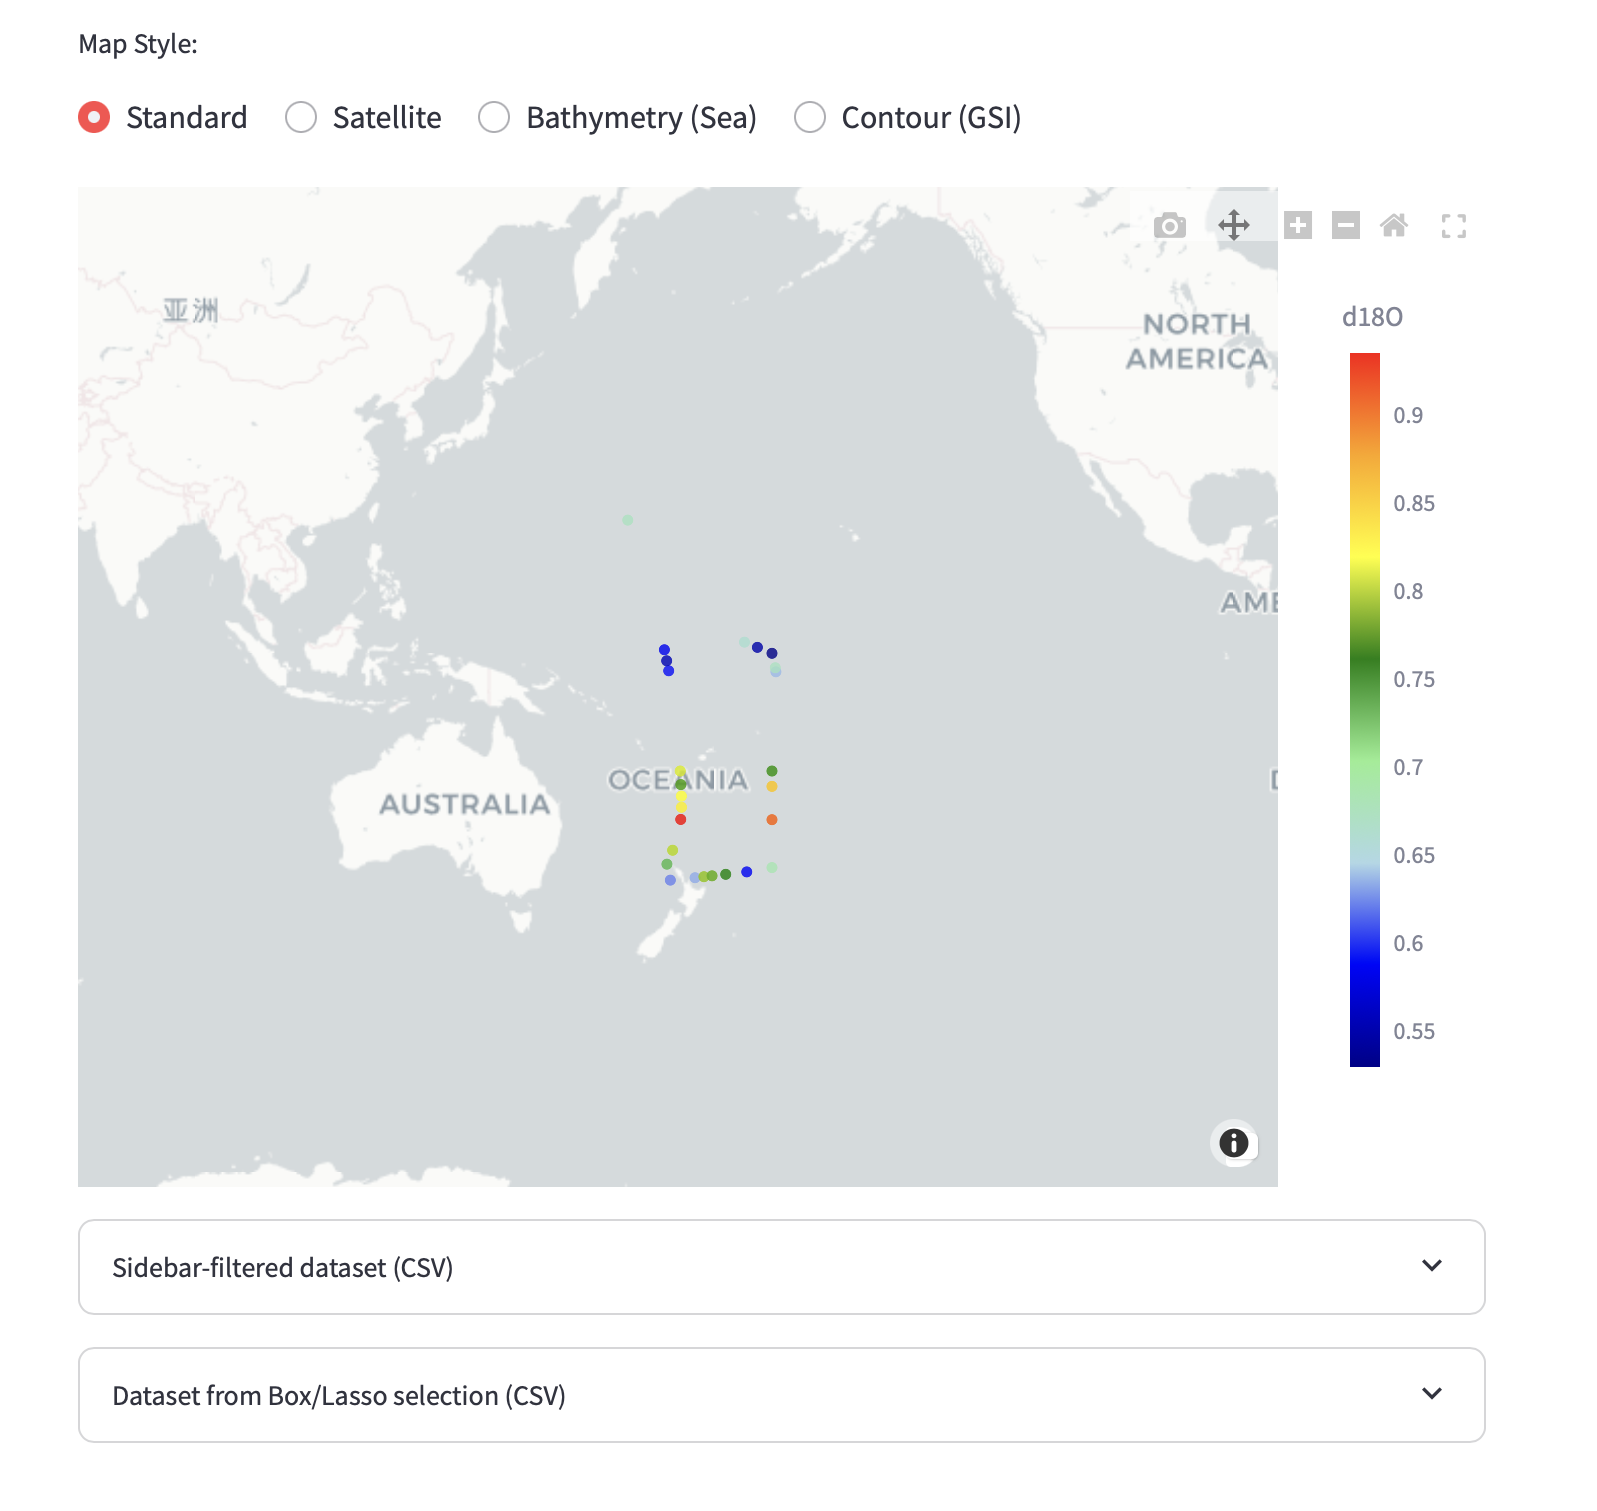
Selection in T–S space can be linked to sampling locations on the map, helping users examine the geographic context of a selected water-mass subset.
Scope of this website
This website covers the ten supported stable application pages. Historical development records and excluded experimental pages are not user workflows and are not presented as part of the stable interface.